Removing the resolution barrier for water index mapping
Water is the foundation of turf quality - and it's under pressure. From golf courses to professional pitches, surface quality directly affects playability, reputation, and revenue. Maintaining it requires precise, often intensive irrigation. In many regions, that level of water use is now under increasing restriction and scrutiny.
The challenge is knowing where water is needed, and where it isn't. Most turf teams rely on visual inspection, handheld probes, and fixed sensors. These methods are trusted, but inherently local - they show what's happening at specific points, not how moisture varies across the full surface.
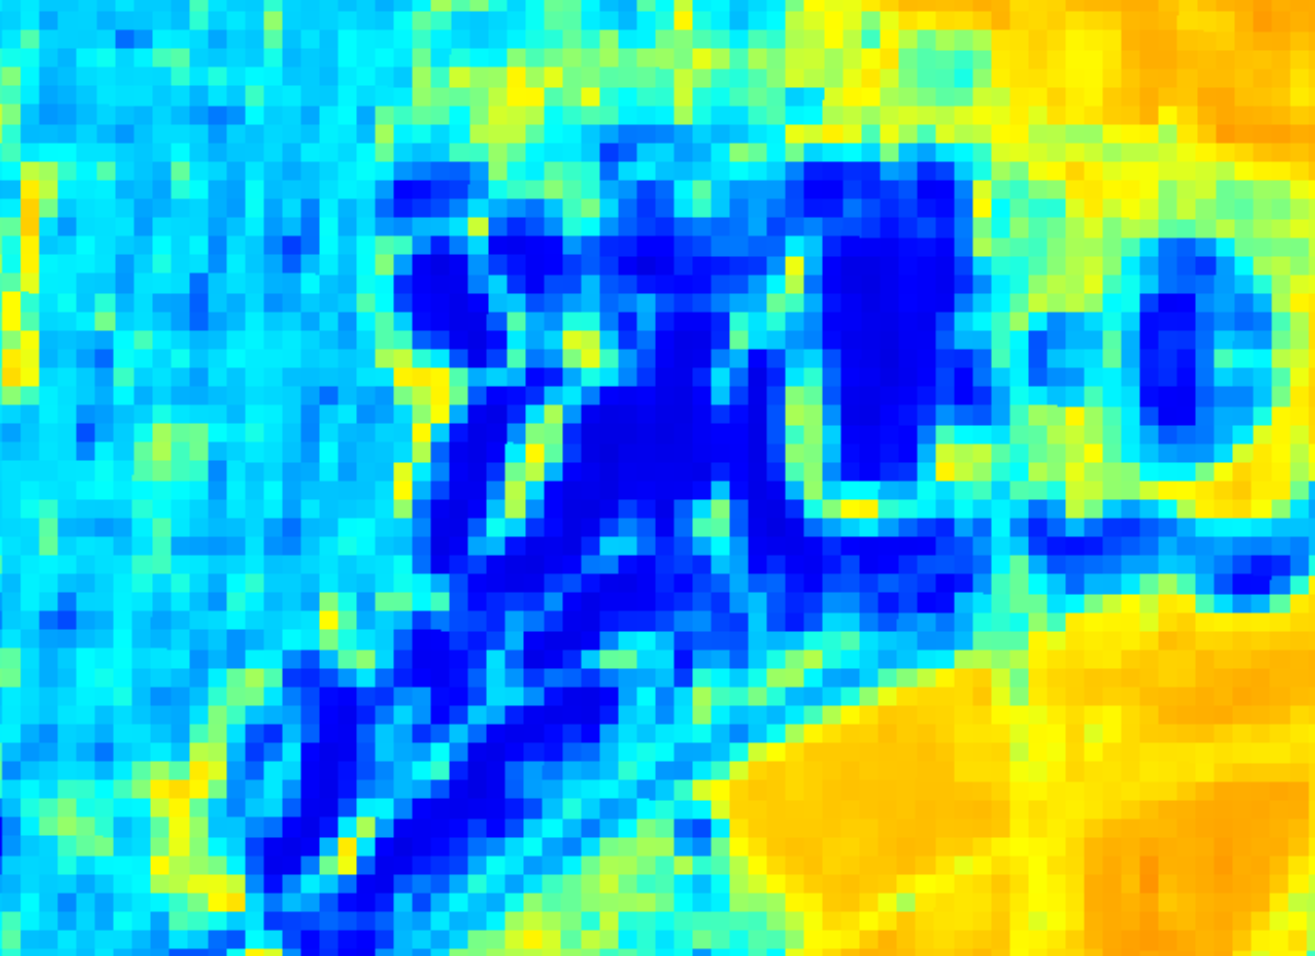
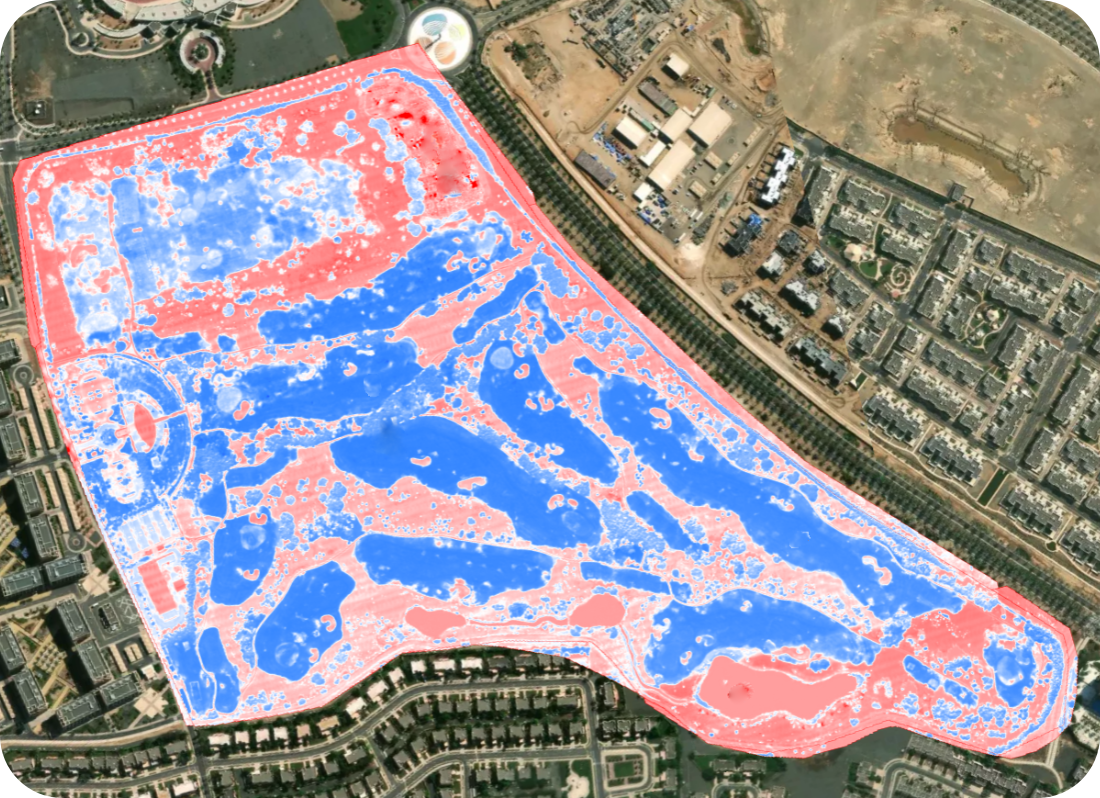
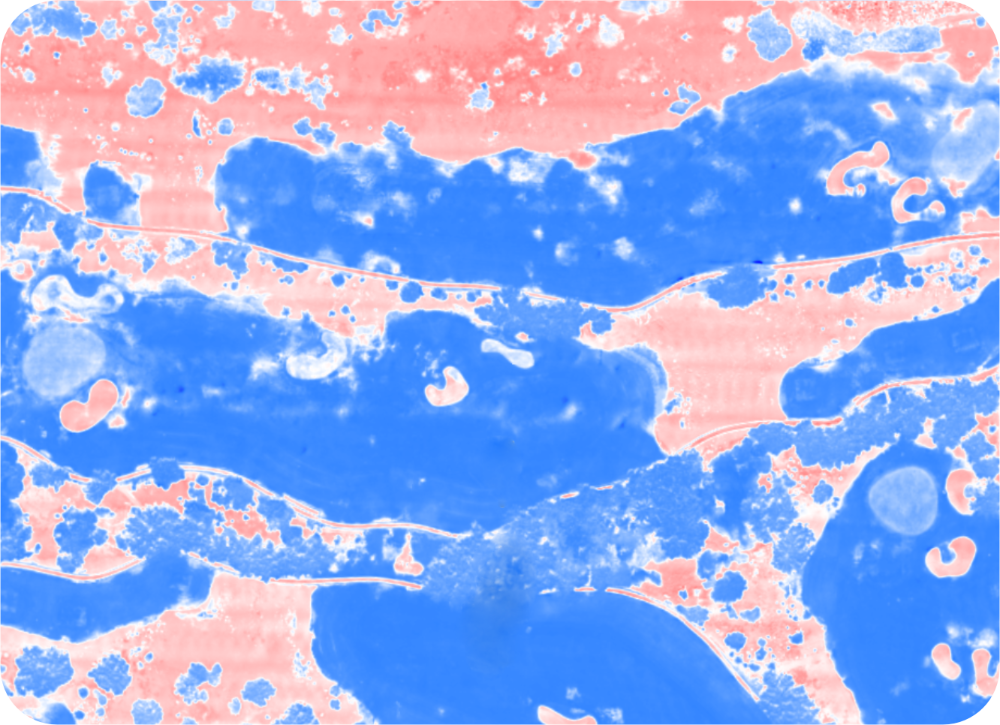
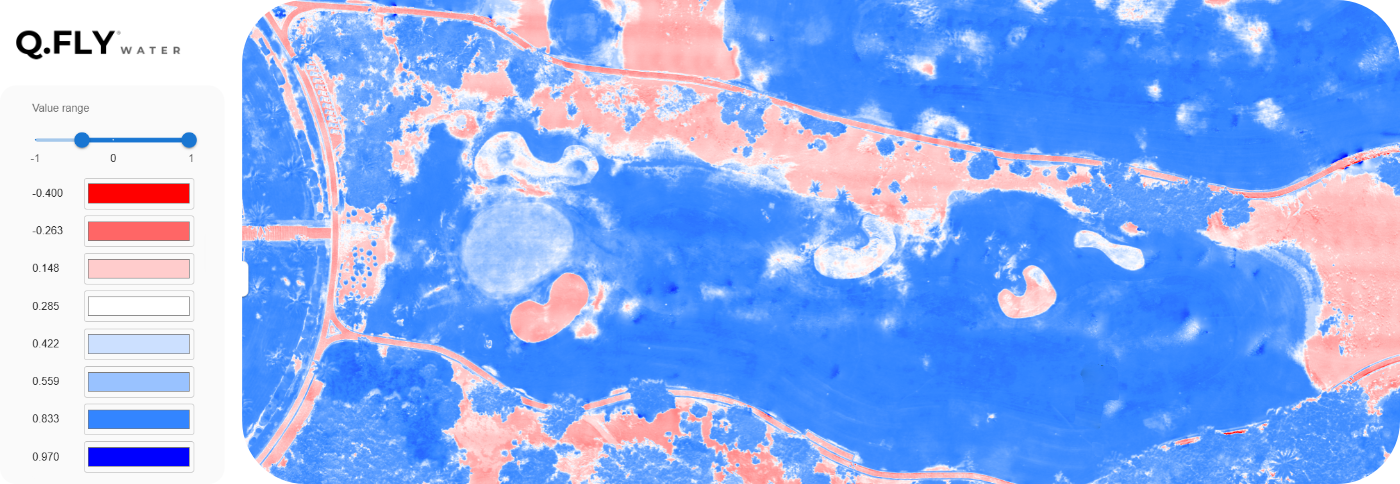
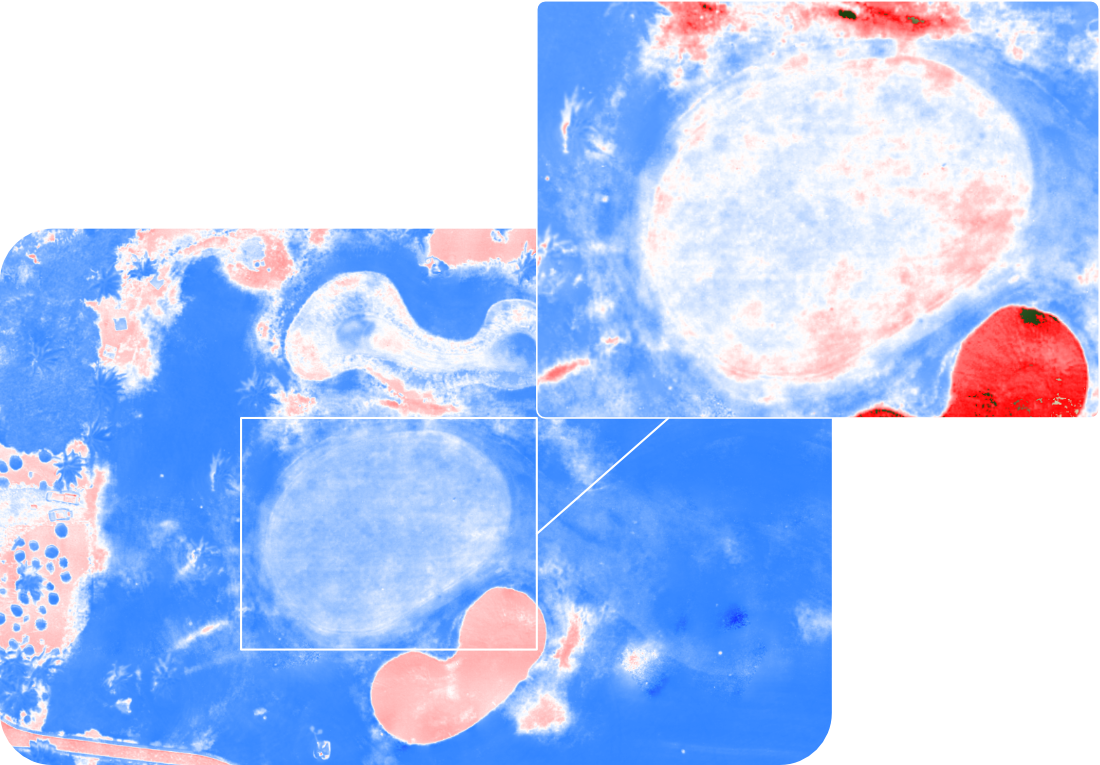
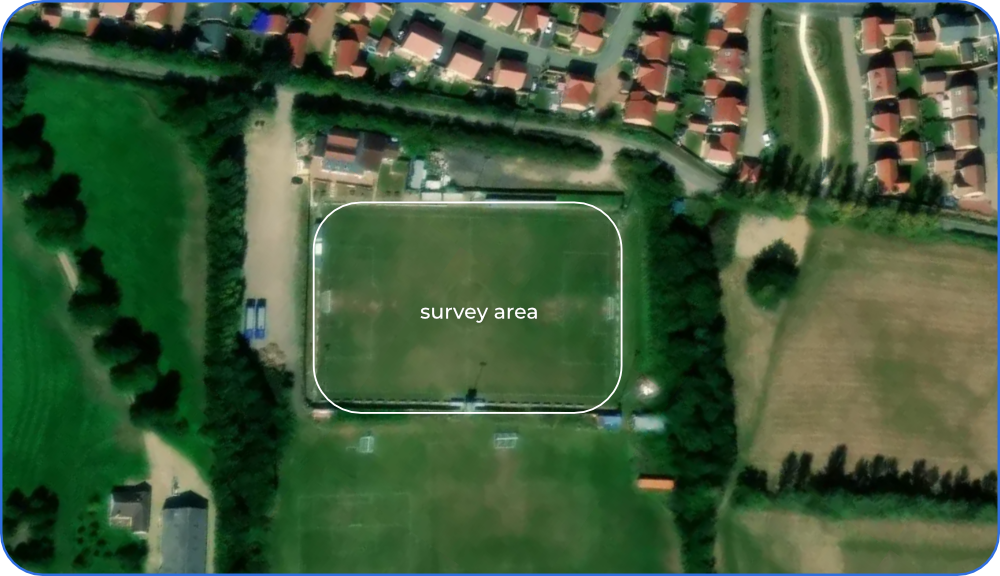
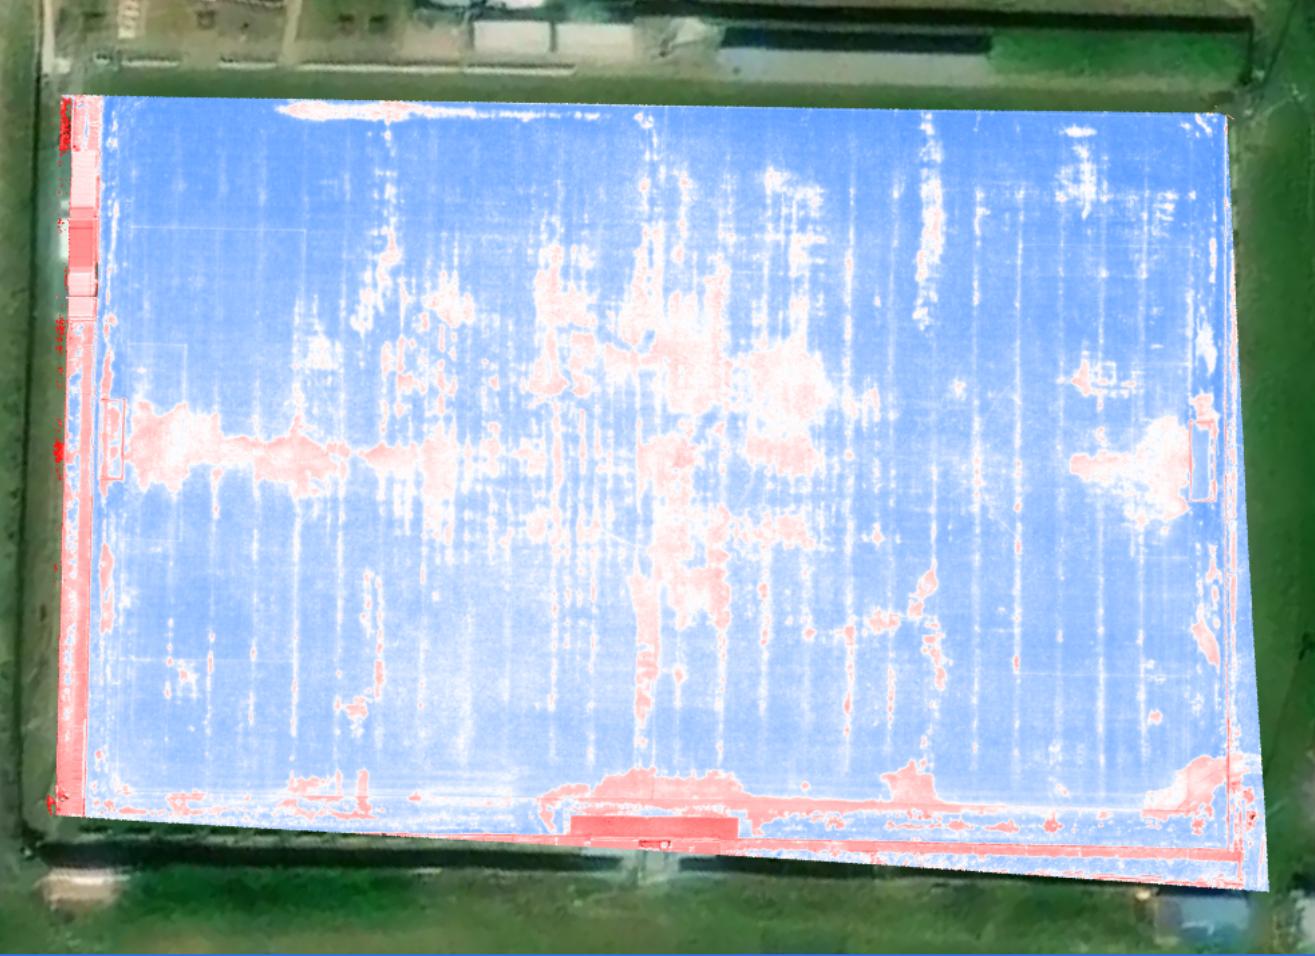
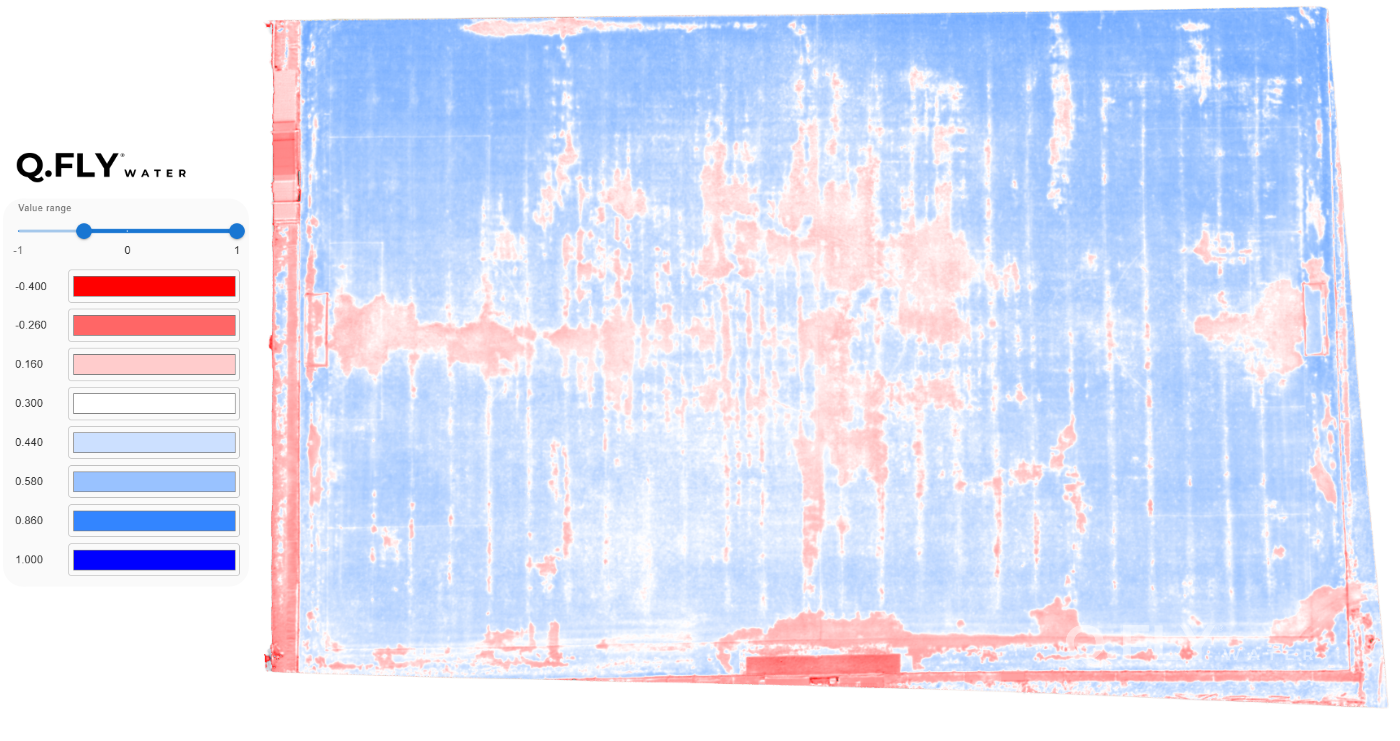
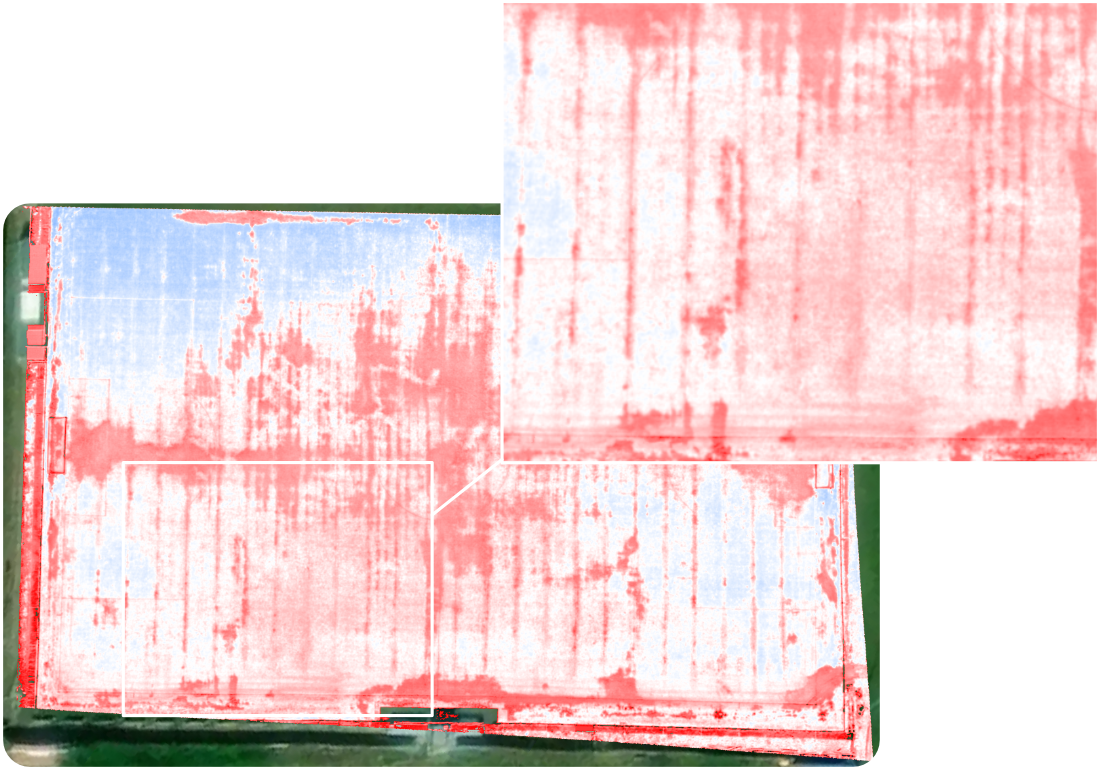
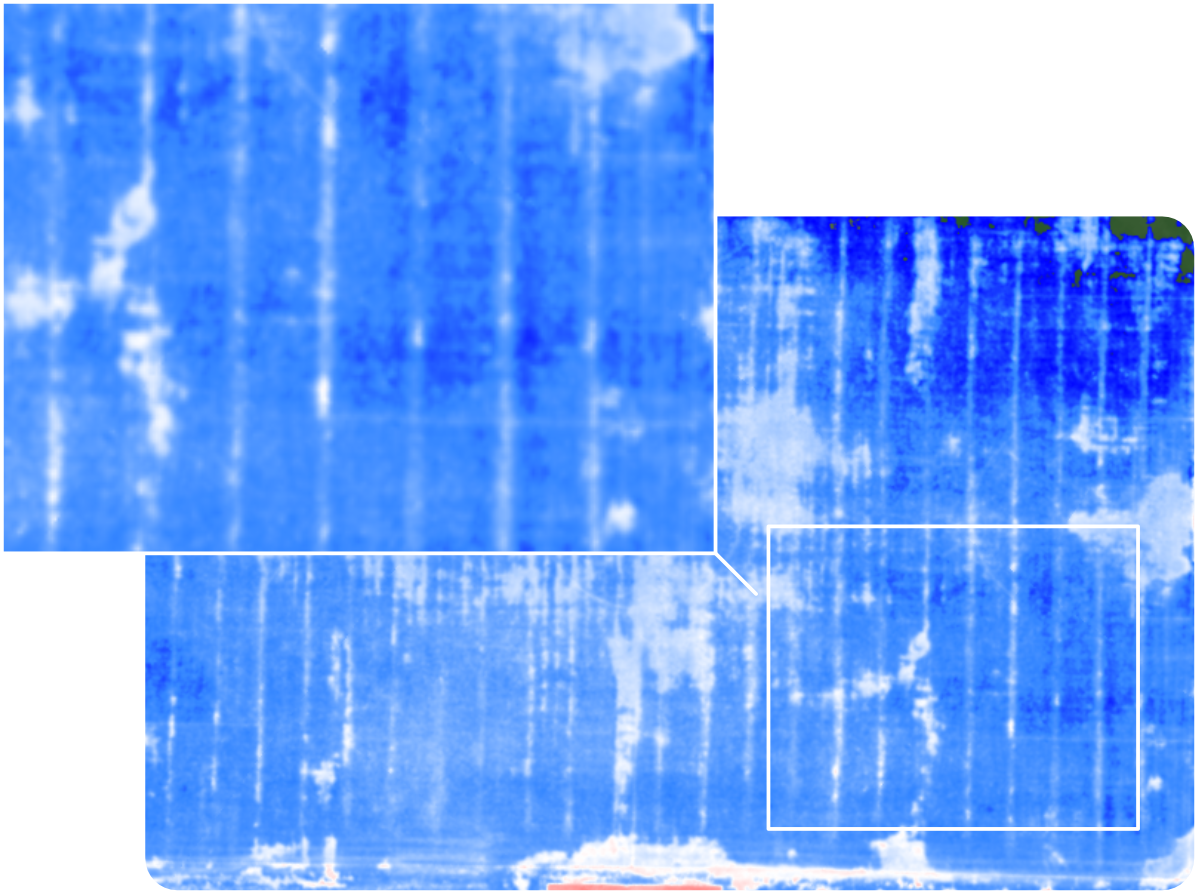
NDMI (Normalised Difference Moisture Index) is an established spectral index for measuring moisture variation across an entire area. Delivered via satellite, the resolution floor of 20m has kept it largely outside practical turf management. Across the two deployments below, we use Q.FLY Water to capture the same index at centimetre-scale resolution and show what becomes visible when that barrier is removed.
A championship-quality golf course operating in one of the world's most water-scarce environments. Optimal irrigation is essential to maintain turf quality.
Our objective was to map moisture variation across a sample of the course and compare against available satellite NDMI data
Comparison data referenced from Copernicus Data Space Ecosystem, Sentinel-2 L1C
NDMI from Sentinel-2 provides a consistent measure of moisture across vegetation and soil. At this scale it is useful for identifying broad trends, but local variation is averaged within each pixel.
Centimetre-scale NDMI captured using Q.FLY Water provides a direct comparison of the same index at much higher resolution. At this level of detail, variation within individual turf features becomes visible, including irrigation patterns, localised dry zones, and fine-scale changes across the surface.
Sentinel 2 NDMI (full course)
Q.FLY Water NDMI (Full course)
Sentinel 2 NDMI of sample area
Q.FLY Water NDMI of sample area
Red = low moisture content | Blue = high moisture content
Identify over and under-irrigated zones for targeted adjustment
Track moisture change over time to prioritise maintenance early
Pinpoint reduced moisture uptake consistent with surface wear
Compressing the NDMI value range isolates moisture variation within a single green, revealing fine-scale differences in surface condition that are invisible at standard display settings. Dry edges, uneven uptake, and early stress become distinguishable before they affect playing quality or require intervention.
A non-professional football club managing a heavily used pitch with visible surface deterioration. Our objective was to evaluate whether centimetre-scale NDMI could detect stress and wear patterns to guide maintenance decisions.
Comparison data referenced from Copernicus Data Space Ecosystem, Sentinel-2 L1C
For smaller, highly managed turf environments such as football pitches, the application of satellite-derived NDMI is severely constrained by spatial resolution, keeping it outside of the maintenance toolkit.
By comparison, centimetre-scale NDMI captured using Q.FLY Water reveals variation across the full surface, including patterns of stress, wear, and uneven moisture distribution.
Sentinel 2 NDMI (Yellow square)
Q.FLY Water NDMI
Red = low moisture content | Blue = high moisture content
Identify areas of high traffic wear and early-stage stress
Linear drainage tiles visible
Variation between drainage lines indicates section performance
To isolate moisture stress across the pitch, the NDMI display range has been compressed further to show values from 0 to 1.000 only. At this scale, all visible colour represents a moisture deficit -white marks the threshold, with red indicating progressively acute stress. Areas that appear uniform in the standard view begin to show meaningful variation, revealing where surface condition is already diverging and where deterioration may follow without intervention.
The linear features visible in the NDMI data correspond to the pitch’s drainage system. These appear due to consistent differences in moisture behaviour along drainage lines, allowing subsurface structure to be inferred from surface data.
This provides additional context for interpreting surface condition, helping to distinguish between stress caused by drainage, irrigation, or usage patterns.
Targeted intervention, reduced waste, and clearer insights.
Redirect water to dry zones and reduce over-irrigation.
Focus on specific areas of failure or stress.
Track consistency and change over time.
Identify issues before visible deterioration.
Replace guesswork with measurable moisture data.
Lower water use and operational spend.
Water intelligence for every surface
Get started